The City’s GIS Services Group (GSG) has released a refresh of Building Footprints data.
To create the update, GSG employed a vendor who flew planes over the city to capture the dimensions (i.e. height, width) of all the buildings in high-resolution imagery. This imagery was then translated into a dataset that geospatial analysts can use to make maps that more accurately represent the built environment and guide urban planning, among a myriad of other uses. And going forward, this data will be updated regularly by the Department of License and Inspections (L+I).
Recently Refreshed Data at a Glance:
- The GIS Services Group refreshed the Building Footprints data and made it available for bulk download (metadata).
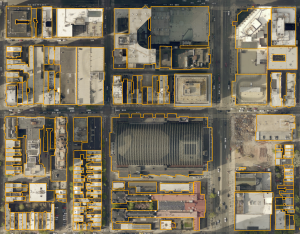
- The outlines of buildings are drawn using aerial imagery. The city’s first set of building footprints were created in 2004. These have been updated based on the physical landscape as of April 2015.
- An improvement offered by the 2015 data is the addition of party walls. Each distinct row home or commercial building, that shares one or more party walls, is now its own feature.
The 2015 Data Update
A building ‘footprint’ refers to the height, width and elevation of a building. The release of an updated building footprints dataset should be celebrated – but for those who don’t make maps or understand geospatial data, the importance of this information can be hard to grasp.
The key difference in the 2015 data is precision. In 2004, this data could only show the entire outline of a row of buildings. In 2014, GSG started a project to map all buildings in a way that would capture their party wall divisions as well. ‘Party walls’ are the dividing partition between two connected buildings or units that is shared by the tenants of each residence or business. Presumably, they’re called such because you could hear your neighbor’s party through your shared wall.
“When you think of how we understand our city as mapped data – the foundations are property boundaries, streets and buildings. Until now, we’ve not really be able to use building outlines to their fullest extent because all the City had was the outline of entire blocks of structures,” said Mark Wheeler, Geographic Information Officer (GIO), who spearheaded this project in 2014 with Grant Ervin, Deputy Geographic Information Officer. “Now, with this update, we can.”
The previous lack of party walls in the footprints data made it particularly difficult to do a geographic analysis to find out just how many buildings fell within a certain tax parcel or even which tax parcel included which building.
Mark Wheeler elaborates on this, “Now with party walls divisions, we have the means to relate addresses, permits and accounts to structures themselves. We can even add a unique building ID to make relationships and lookups easier. This adds a whole new level of meaning, precision and opportunity for anyone who wants to analyze the built environment.”
This project rested on a general effort by GSG to create a new ecosystem for GIS layers that make up the City’s base map. Building Footprints are now a foundational piece of that along with tax lot boundaries. All together, this work enables deeper and more accurate analysis that the City, and members of the public that use these datasets, couldn’t do before.
The Value of Building ‘Footprints’
So what does this all mean in the real day-to-day?
Buildings are more than just where we go to work, learn, read or buy groceries. They are also part of an entire ecosystem of data that will greatly advance our ability to serve the public – whether through 911 and other emergency response, decreasing billing incongruencies, allowing more detailed property assessments or better planning for inspections, as well as facilitating general city planning.
For instance, GSG has used this data to prepare a tool for L+I to locate holes in roof tops by pairing building outlines with raw LIDAR elevation data. The tool looks for dramatic changes in elevation along what should be a relatively consistent surface. L+I analysts then confirm visually with updated aerial imagery of that location. This not only can help address safety issues, but it also makes the planning and intervention process more efficient and focused. You could even associate this data with L+I’s permits to know where construction or deconstruction (the tearing down of buildings) will occur.
What’s more – any City department that has address-based data can now include these structures in their maps to advance their particular analytical and program goals. This can help with one of the biggest data challenges in the City: reconciling addresses. Official deed addresses – or tax account addresses – may differ with those addresses that represent apartments or commercial businesses whose front door is on a side street and technically different from the official tax account address. Having accurate footprints helps assessors, inspectors, planners, engineers, lawyers, etc., do their jobs better with more accurate information at their fingertips.
GSG also has the ability to interrelate all of the various addresses for a building to a fixed feature on the map. Each building will have its own unique, unchanging ID. This ID can be related to its surrounding tax parcel, the addresses associated it with it, the tax account numbers, etc.
Currently, GSG is working to support L+I’s GIS team, which will now maintain the footprints dataset. The goal is to maintain a realistic “topology” – meaning the strict geographic relationship between where an edge of building ends and begins with where the edge of sidewalks, side yards, or other features begin and end. This type of spatial consistency is vitally important to the various needs of GIS analysts, researchers, businesses, city workers and others.
Keep in Touch!
There’s lots of ways to get involved. For information about City datasets and others, go to OpenDataPhilly.org. Visit this resources page for video tutorials and links to tools to help analyze data. Follow @PHLInnovation on Twitter to get alerts on future data releases, share how you plan to use open data with data@phila.gov, and join us on the public open data google forum.