What we do
The Office of Sustainability (OOS) works with partners around the city to improve quality of life in all Philadelphia neighborhoods. We work to:
- Advance environmental justice.
- Progress Philadelphia’s climate and energy goals.
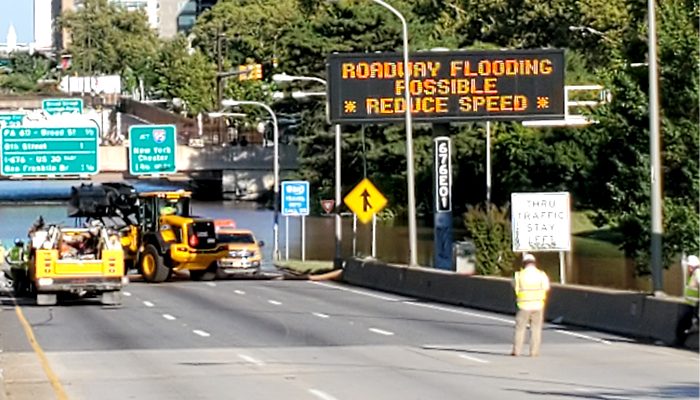
- Prepare the city for a hotter and wetter future.
OOS is made up of four divisions that carry out our programs, policies, and strategies.
- Climate Resilience
- Energy and Climate Solutions
- Environmental Justice
- Policy and Strategic Initiatives
For more on what we do, read about our divisions.
Connect
| Address |
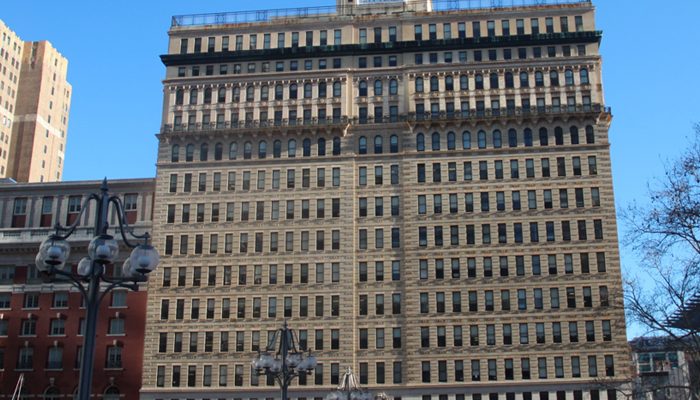
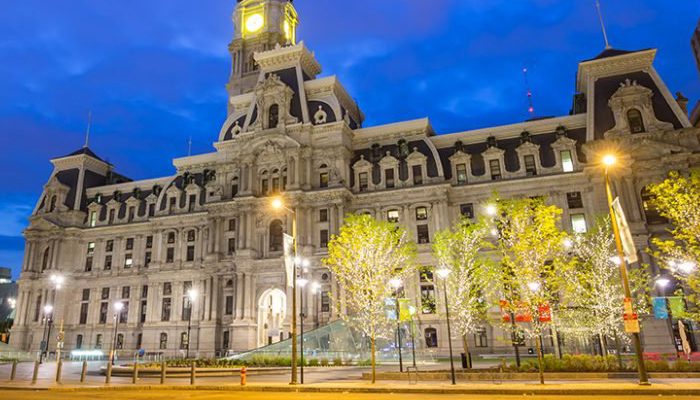
One Parkway Building
1515 Arch St., 13th Floor Philadelphia, PA 19102 |
|---|---|
|
sustainability |
|
| Phone |
Phone:
(215) 686-3495
|
| Social |
Get involved
Stay informed and join our work through our newsletter, events, and social media posts.