Are you thinking of inviting the Department of Revenue to your next community event, but don’t know which neighborhood or population to target? Don’t worry, we’ve got the tools to help!
Whether you’re planning a seniors’ fair to sign up more elderly homeowners for the Senior Tax Freeze program or a neighborhood event for low-income families to sign up for the new Low-income Tax Freeze program, we can help you tailor your event.
Use our maps to direct your outreach
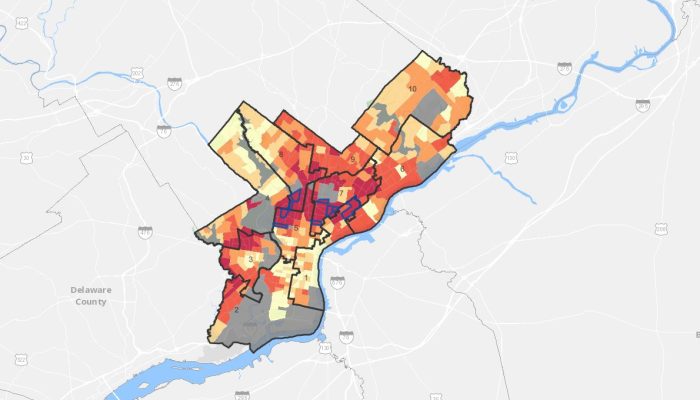
We’ve launched a series of targeted outreach maps to improve enrollment in our property tax relief programs. The maps show us where to focus on to get more people to sign up.
Specifically, they help us identify the most vulnerable populations in the City, including low-income families, seniors, and people of color, who are eligible for our programs but aren’t taking advantage of them. We want to make sure every homeowner knows about and can access our programs.
You, too, can use our maps to customize your community events. They’ll guide your targeted outreach, such as direct mail, in-person or virtual events.
Why we created these maps?
The City offers a range of property tax relief programs to help homeowners:
- Save money,
- Pay their Real Estate Tax bills, and
- Avoid possible home loss.
The Owner-Occupied Payment Agreement (OOPA) program is one of them. With this program, owners who can’t pay their bills in full can pay in installments. It allows you to spread your payment out over time. This way, your bill is affordable, and your home is protected from tax sale.
There’s also the Senior Tax Freeze and the Low-income Tax Freeze that keep property taxes from going up. Find details at phila.gov/tax-freeze. You can also save big on property taxes with the Homestead Exemption. You only need to apply once to enjoy these discounts. But only 75% of eligible households are enrolled.
The good news is that Revenue is always looking for ways to ensure homeowners have access to programs that will save them money. That’s why we created 13 targeted outreach maps to help us identify those most in need of our programs. The maps are dynamic, which means they’ll be updated regularly as new outreach data becomes available.
They’re easy to read
The maps are very simple and easy to read. They’re based on data from the Census Bureau and our own tax records. They provide statistics on residential real estate tax and water delinquencies, senior populations, median income, key demographics, assistance program eligibility, and more.
You can either select the tabs above or scroll down to view the maps one by one or as a group. We’ve color-coded each map for easy understanding. For example,
- Darker colored areas show neighborhoods in urgent need of outreach,
- Lighter colored areas mean less outreach may be required in this neighborhood, and
- Gray areas indicate limited data, such as non-residential areas including airports and parks.


