PHILADELPHIA – The Department of Revenue announced today that Wage Tax collections from beverage-related businesses have demonstrated continued growth in the two years since the inception of the Philadelphia Beverage Tax.
Wage Tax collections — a barometer of employment in Philadelphia — have increased steadily by 2.5% per year and have not been affected by the PBT, for 24 industries potentially affected by the tax, including supermarkets.
In fact, the pace of growth in collections for those sectors that was seen in two years prior to the tax was exceeded in the two years since inception of the PBT. Wage Tax collections for one key sector — supermarkets — have grown nearly 3% each year since the tax took effect.
It also shows the top 4 industries potentially impacted by the tax and those more broadly affected all show growth in wage taxes from 2016 – 2018. (The only decline observed is due to a large supermarket chain closing in 2015 before the PBT was introduced)
“As the beverage industry pours some of its vast profits into advertising aimed at defeating the beverage tax, I urge residents to ignore their rhetoric and see the reality of this new data,” said Mayor Kenney. “This sector of our economy was strong before the tax and is just as strong, if not stronger, since the tax. At the same time, the PBT has generated funds for crucial investments in PHLpreK, Community Schools and Rebuild. That is the reality — and it will lead to a stronger Philadelphia for years to come.”
Details of the Wage Tax collections analysis:
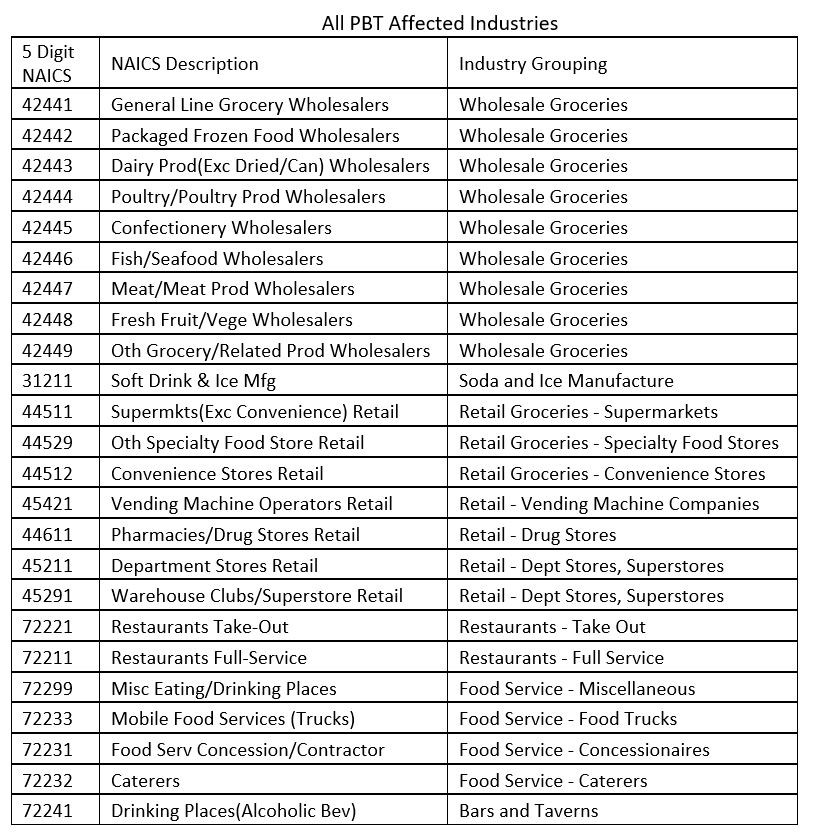
The Department of Revenue looked at Wage Tax collections in 24 NAICS industries potentially affected by the Philadelphia Beverage Tax (list below). Data is from Calendar Year 2015 through Calendar Year 2018.
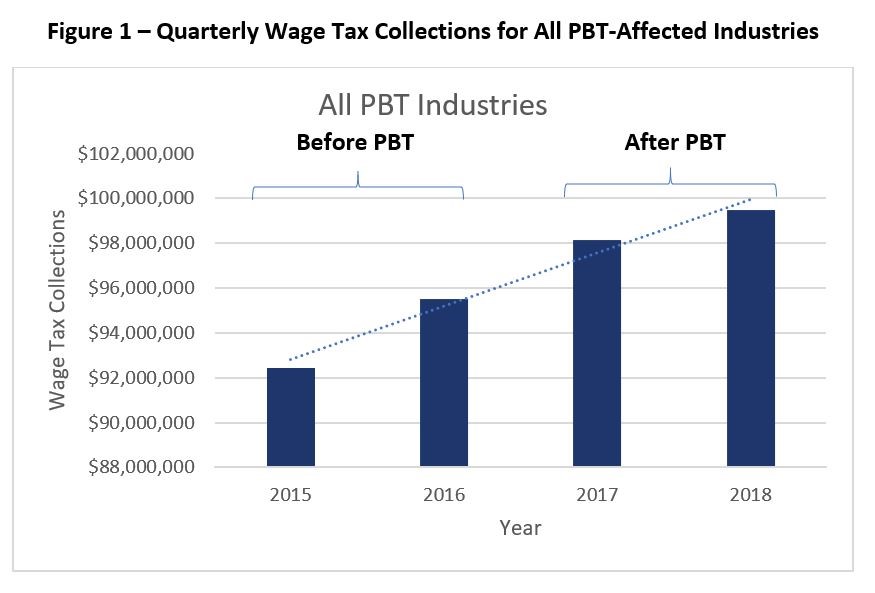
- Calendar year tax collections have increased steadily, about 2.5% per year – even with annual rate reductions. ($92.4M collected in 2015, $95.5M in 2016, $98.2M in 2017, and $99.5M in 2018).
- Tax collections in 2018 were 1.3% higher than in 2017, the first year of the PBT.
Accounting for ongoing Wage Tax rate reductions, the growth in actual wages and salaries paid to employees in these sectors was even higher.
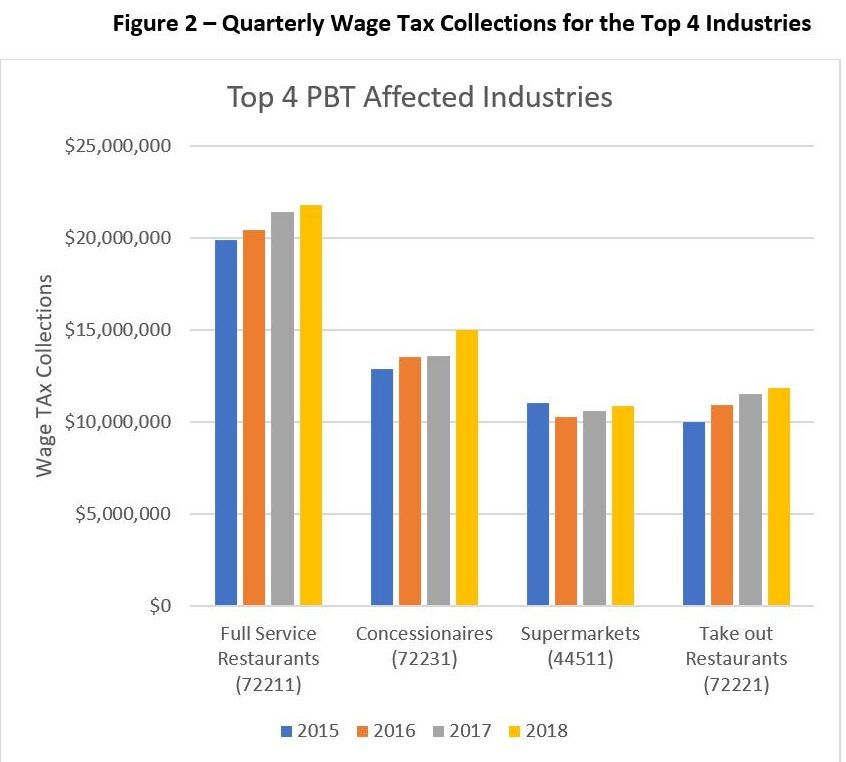
The top four Industries represent about 60% of all Wage Tax collections from affected industries:
- Full Service Restaurants: eg. any traditional sit-down eatery
- Concessionaires: eg. Aramark, Sodexo
- Supermarkets: eg. Shoprite, Sprouts, Trader Joe’s
- Take Out Restaurants: eg. neighborhood hoagie shop
- Overall, total Wage Tax collections for the top 4 industries have increased from $53.8M in 2015 to $59.5M in 2018 (about +3.4% annually)
- Supermarkets were the only industry among the top four to have a year-to-year decline — however that decline was from 2015 to 2016, before the PBT became effective. Since the tax took effect, supermarket wage tax collections have shown steady growth.
- This growth comes despite the fact that this was the one industry that, in several instances, chose to advertise the tax
- The 2015-2016 decline is attributed to multiple store closures in Philadelphia in 2015, prior to the tax. Collections have increased consistently since 2016 (+2.9% annually)
- All other PBT industries have grown at a more modest rate, +1,1% annually since 2015 ($38.6M to $40.0M)
Restaurants including take out and full service continue to have strong Wage Tax collections growth
Similarly, a recent study in the scientific journal PLOS ONE found that the unemployment filings in Philadelphia industries potentially affected by the beverage tax did not change in the year after the tax was implemented:
- Results showed that there were no changes to unemployment claims in Philadelphia compared to neighboring counties after the tax took effect for any of the business sectors they studied.
- Unemployment declined in Philadelphia similar to both the surrounding counties and Allegheny County in each of the sectors studied.
- The researchers concluded that public claims of increased unemployment within the first year following the implementation of the Philadelphia beverage tax are not supported by this analysis.
In other sectors, the Philadelphia Beverage Tax has been a job creator.
- In its first year, the tax created 275 new living wage jobs in early education and 120 summer job and career exposure experiences for students.
- Ninety neighborhood residents have also gained employment through trainings hosted by PBT-funded Community Schools.
- Community Schools have also connected 260 students with career readiness opportunities, and helped 90 City residents connect directly to job training and guaranteed living wage jobs.
- Rebuild, the ambitious renovation of our parks, rec centers and libraries will also provide many Philadelphians with a lifelong career in the trades.
In its first two years, the Philadelphia Beverage Tax (PBT) has generated nearly $200 million, allowing over 4,000 three- and four- year old children to access high quality early education, increasing to 5,500 seats by FY23. The PBT has led to the creation of 12 Community Schools serving 6,500 students. The number of Community Schools will grow to 20. At the same time, we have initiated the first of three borrowings to rebuild parks, rec centers and libraries. The beverage tax has already made a substantial impact on the lives of Philadelphia families struggling amid rampant poverty.