As Philadelphia prepares for the holidays, there’s no better time to think about how lighting (and other energy uses) both inside and outside our buildings can be more efficient. To help building owners, operators, and users of buildings understand how buildings compare to one another, today we’re publishing 2015 and 2016 data from Philadelphia’s energy benchmarking program.
The energy benchmarking program helps large building owners and managers in Philadelphia better understand their energy and water use. Using an EPA tool, more than 2,800 buildings throughout Philadelphia report and disclose their energy usage. Many of these buildings are rated on a 1-100 ENERGY STAR scale. (One City-owned building has already used this tool to improve its energy efficiency.)
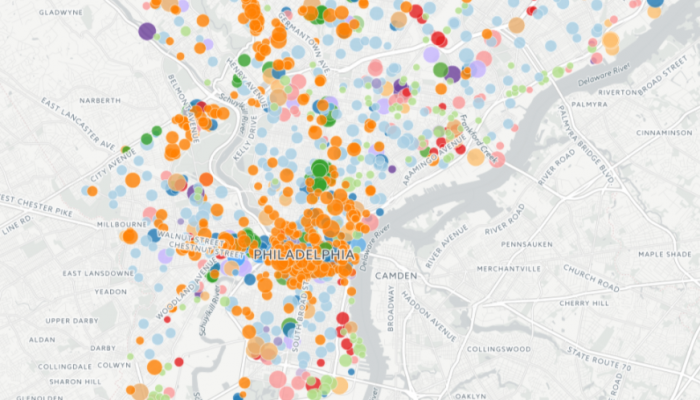
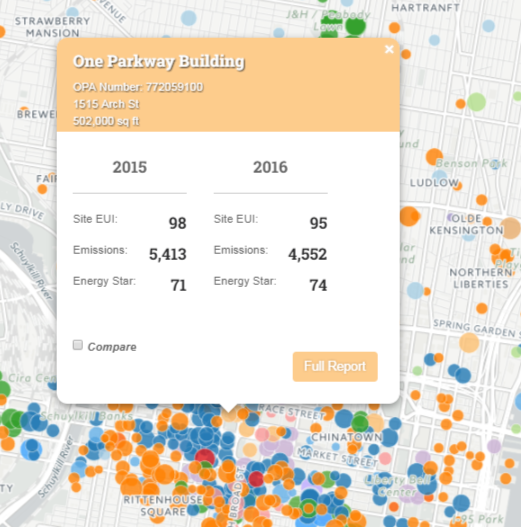
Data for commercial buildings has been available since 2014. For the first time, we’re also publishing energy performance data for all residential buildings over 50,000 square feet. Tenants in these buildings can use our data visualization map to see how their building compares to its peers around Philadelphia to both take action at home and encourage building management to pursue efficiency upgrades.
Nearly 30 percent of the energy used in our buildings is “energy waste,” escaping through drafty windows or lost heat from an incandescent light bulb. Investing in energy efficient systems and practices in our homes and businesses can improve comfort, cut costs, and contribute to Philadelphia’s climate goals.
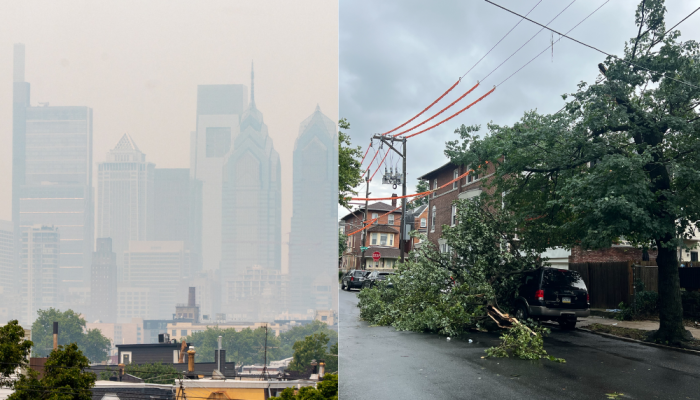
In Philadelphia, building energy use accounts for more than half of our carbon emissions. Earlier this month, we released the draft of Powering Our Future: A Clean Energy Vision for Philadelphia, a roadmap for reaching our climate goals in part by reducing energy use.
To learn more about Philadelphia’s energy benchmarking program, visit phillybuildingbenchmarking.com.